An application is considered to have poor performance so how to analyze the application. That time we can use profiling to fix the performance problem that your application causes to inefficient users of resources such as the CPU, memory, graphics, network, and device battery.
Android Studio provides several tools to find problems.
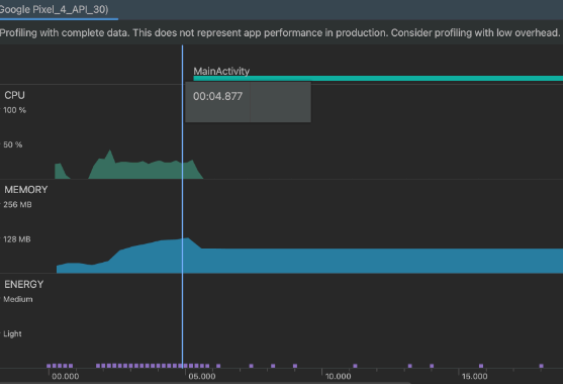
1. CPU Profiler tack runtime performance of issues.
2. Memory Profiler tracks memory allocations.
3. Energy Profiler tack energy usage of battery
Profitable applications
Profitable is a manifest add code introduced in Android Q.
It can specify whether the device can profile an application through tools such as Android Studio.
Feature list
1. Memory Profiler
2. CPU Profiler
3. Network Profiler
4. Energy Profiler
5. Power Profiler
6. Event Monitor
Add the below line in the manifest (application)
- Build and run profitable apps automatically
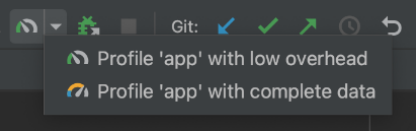
- Profile ‘app’ with low overhead CPU and Memory profilers in the memory profiler
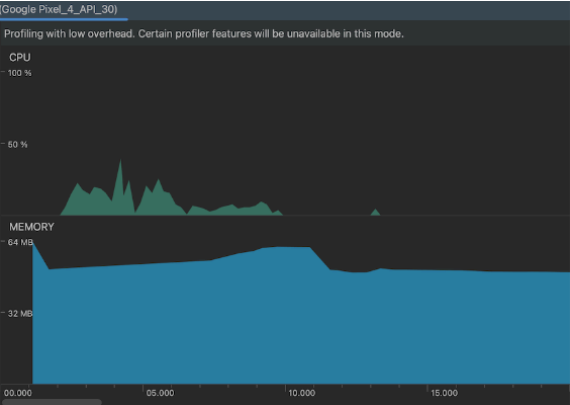
- Profile ‘app’ with low overhead CPU and Memory profilers in the memory profiler.
- Build release app
Write the below code in application level build.gradle.kts
In conclusion, by profiling your app, you will know which areas are slowing slowdown or causing resource bottlenecks. Hence, you can focus on the mobile app development process of your app running smoother and deliver a better user experience.
Remember, performance profiling is an ongoing process. As you add new features or make changes to your app, it’s important to revisit profiling to ensure optimal performance.