THIS TREND WILL USEFUL TO ASSESS THE RISK OF DIFFERENT ACTIVITIES USING GOOGLE MAPS
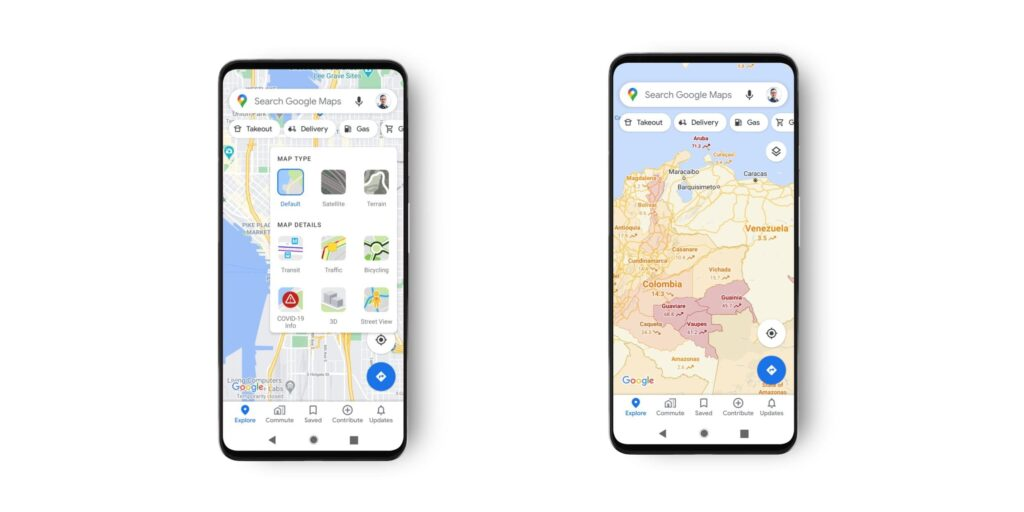
Image Source : Google
Google Maps are going to include information about COVID-19 spread in Countries, States and Cities. Once you toggle on the “COVID” layer in the app it will show a 7 day average number of confirmed cases in that area per 1,00,000 people.
There is a facility to show color based areas in MAP based on case rate and the label shows that cases are going up or down. By this week google will roll out for Android and iOS.
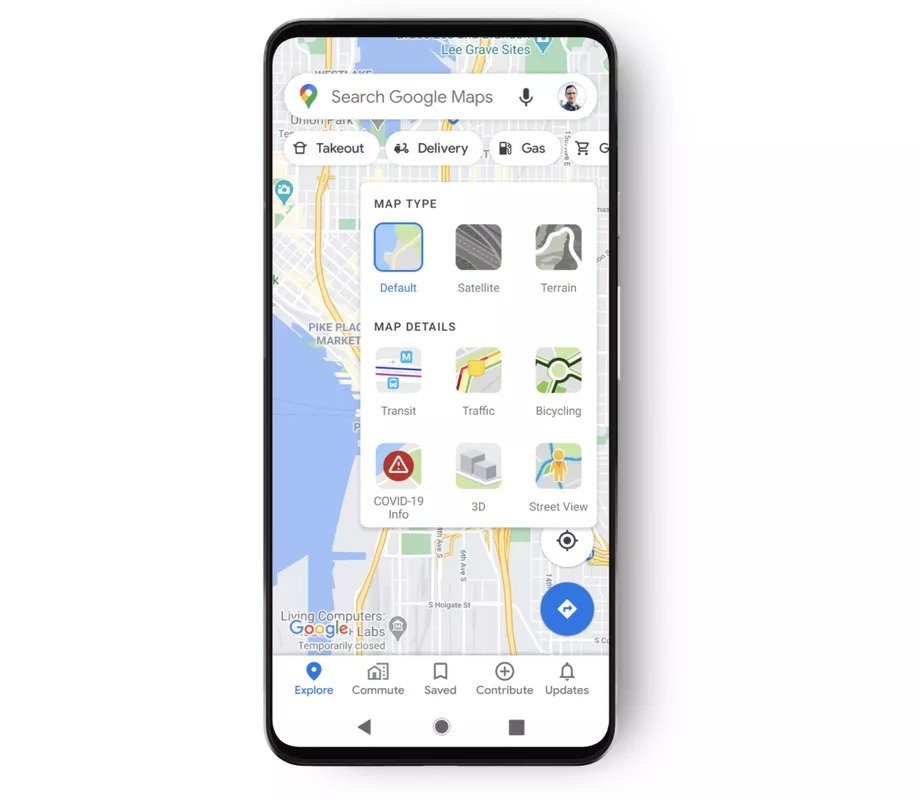
Image Source : Google
From the Google Blog Post, Google Maps Project Manager Mr. Sujoy Banerjee said that this layer will help people to make more precise decisions about where to go and what to do.
The Centers for Disease and Prevention (CDC) and Public health experts recommend that it is necessary to keep track of spreading details of COVID-19 in the area to find out the risk of certain activities.
It is important to know about transmission rates in local communities for families to monitor the area before going to holiday plans or parents to decide whether they can send their kids to school or not.
The COVID-19 overlay pulls the data from The New York Times, Wikipedia and Johns Hopkins Dashboard.
This features is one of the many current pandemic situation related features introduced by Google Maps from past few months – This app also includes some alerts about Mask (Face Covering Mandates) while public transportation, Information about takeaway options in restaurants and some warnings to call to doctor if you think that you are affected by COVID-19.
More Articles Related to Google